By GILLIAN POMPLUN
Crawford County Independent
Dan Baumgardt, Chief Science and Operations Officer for the National Weather Service in La Crosse, has documented a trend of increasing rainfall impacting the Driftless Region since about 2008.
In particular, his research shows that from 2016 to 2019, the percent of days in the region with rainfall events of one inch or more has more than doubled compared with the percent of days from 1970 to 1999.
“My research into rainfall trends started with a question – is it raining more?” Baumgardt said. “In 2008 we saw the breach and emptying of Lake Delton and the flooding in Cedar Rapids, Iowa; on July 11, 2017, we had a flash flood emergency in northeast Iowa and far southwest Wisconsin after the area received more than eight inches of rain in five to six hours; in August of 2018, an area near the border of Wisconsin’s Vernon and Monroe counties received ten to twelve inches of rain overnight that caused the breach of five flood-control dams and historic flooding.”
From 1970 to 1999, the percentage of days with more than one inch of rainfall was 1.75 percent or approximately 6.5 days per year. From 2016 to 2019, the percentage more than doubled to four percent, or approximately 14–15 days per year.
The area that Baumgardt is talking about covers Iowa, Minnesota, Wisconsin and Illinois, roughly between Interstates 80 and 90. The normal precipitation for the area is typically about 35 inches per year.
“In 2018, Harmony, Minn., recorded 60 inches of rainfall,” Baumgardt said. “In the same year, northeast Iowa received the same.”
The area he described received nearly one foot more rain per year than the maximum rainfall recorded for the area for the previous 41 years.
Baumgardt explained that if you look at the maps of recorded precipitation, the area including the Driftless Region “really stands out.”
“The 2019 precipitation in the region was 150-200 percent of normal levels,” Baumgardt said. “These increases in rainfall create a situation of soil saturation, which really decreases the soil’s capacity to infiltrate more water and increases the likelihood of runoff and flooding.”
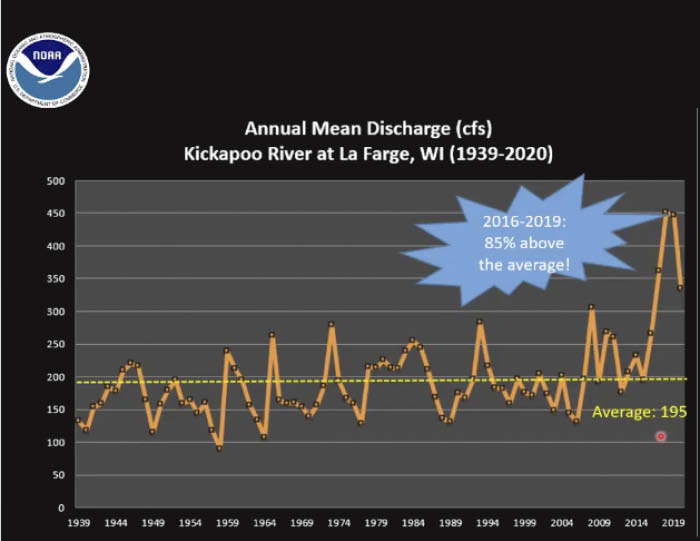
Baumgardt said that discharge levels into rivers are a great measurement of these precipitation increases. For instance, the U.S. Geological Survey has maintained a stream gauge on the Kickapoo River in La Farge since 1939. These gauges measure the amount of water flowing in the river in cubic-feet-per-second (cfs).
“The average cfs at the La Farge Station is 195,” Baumgardt said. “In the 2016 to 2019 time frame, the cfs or amount of water flowing in the rivers was 85 percent above the average.”
The data shows that these extreme weather events have disproportionately occurred later into the summer and the early fall. He said that one factor that could influence that timing of these rainfall events is that it is pre-harvest, but when crops are approaching maximum canopy.
“When there is excessive moisture in the soil, then the plants will transpire more water,” Baumgardt said. “That increased moisture in the atmosphere provides additional fuel for these intense rainfall events and is likely part of the explanation about why they seem more likely to occur at the end of the growing season.”
Baumgardt explained that “2020 had presented a break in the pattern” even though, after 2019, the area had started the year with very high soil moisture levels. He said that the drought that impacted some of the westernmost portions of the area, from Nebraska into western Iowa, may have had an impact on a break in the trend.
Baumgardt said that based on his findings, “there is no question that we are in an anomalous precipitation period across the region.” The data shows that extreme rainfall events are increasing across the region, and the rivers are running historically high, which begets more flooding.